plot col wrap
Usage
plot_col_wrap(
  data = NULL,
  mapping = NULL,
  stat = "identity",
  position = "dodge",
  key_glyph = NULL,
  width = NULL,
  na.rm = FALSE,
  show.legend = NA,
  inherit.aes = TRUE,
  group,
  lab_y,
  ...
)
Examples
ggplot2::presidential |>
dplyr::mutate(
  days = as.numeric(end - start) + 1
) -> data

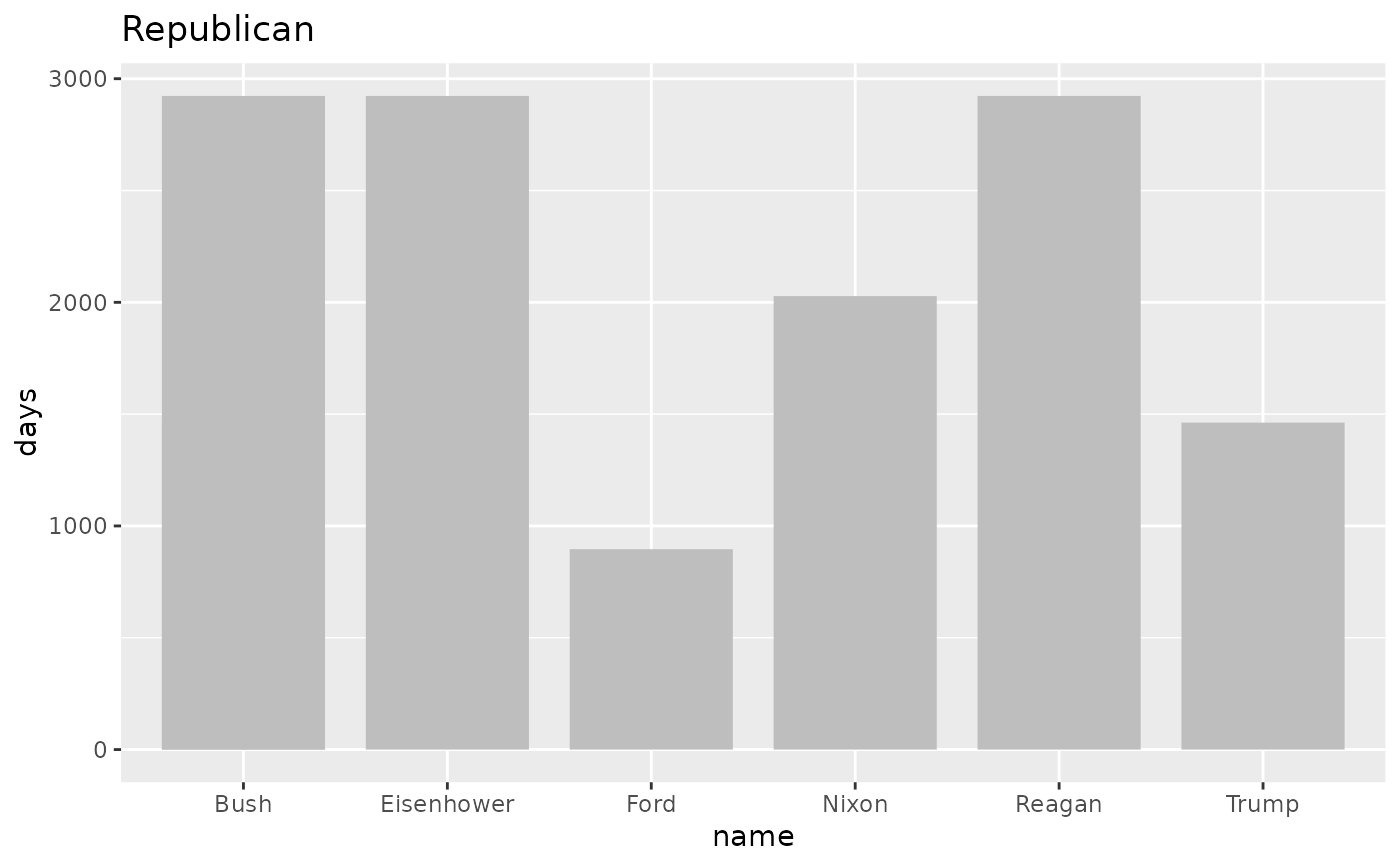
plot_col_wrap(
  data,
  mapping = ggplot2::aes(x = name, y = days),
  width = .8,
  group = c(party),
  linewidth = .1,
  fill = "gray"
)
#> $Republican

#>
#> $Democratic

#>
#> $Democratic
 #>
#>